Chart 1 and 2
Combo Chart
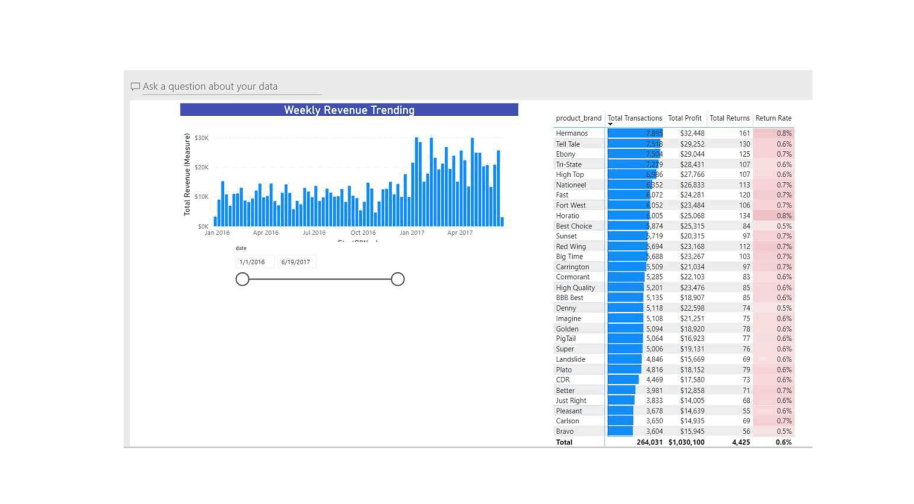
Specified Time Frame
Numbers for a speciefied time period.
Numbers for a speciefied time period.
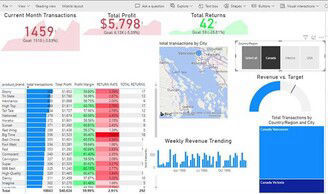
This is combo of a bar chart, matrix and a slicer. In this illustration, the slicer covers the entire time period from 1/1/2016 through 6/19/2017. The matrix displays total transactions, total profit, returns and return rate.
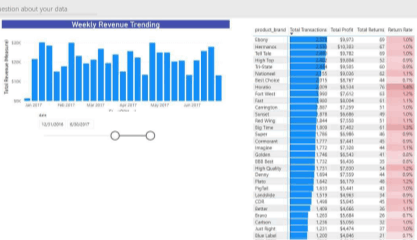
Same chart as Chart 1, but now the slicer has limited the data to 12/31/2016 to 6/19/2017. The bar chart and the matrix change accordingly.
Key Performance Indicators.
All results on one page.
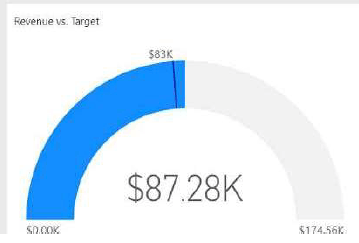
This shows the addition of a KPI, showing Revenue in relation to target. It shows: “we have a long way to go!”
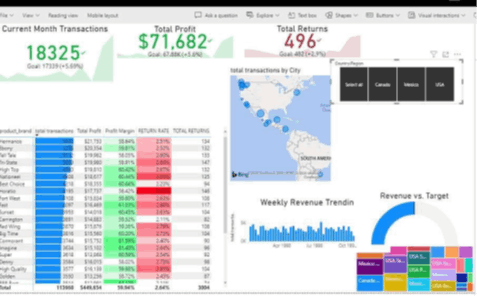
This includes KPIs for transactions, profit and returns, as well as a Matrix
for all numbers., with a filter showing the top 30 items by transactions.
A map that is interactive in that a slicer decides whether ort not you see “all” countries or a selection. A tree map illustrates states/regions/cities, depending on the country selection you make. The KPI for Revenue vs. Target is included
Key Performance Indicators.
All results on one page.
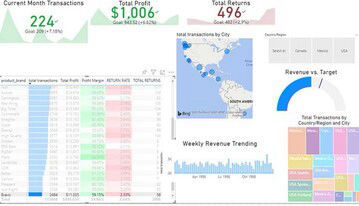
Here we selected Canada only. As is evident the story is that Canada could do a LOT better. They are only in one area of the (in the regions of Vancouver and Victoria - beautiful spots by the way), but their returns are down, which is good (green), but both transactions and profit stink!
Oh, Canada!
Here just one product brand (Bravo) is selected. It shows where and when it sells and how so many products are returned (as part of this product brand)! Transactions and profit are up, but do something about those returns, will you?